Gate Weekly Report: BTC ETF sees nearly $1 billion in weekly inflows, Aave impacted by KelpDAO incident

Summary
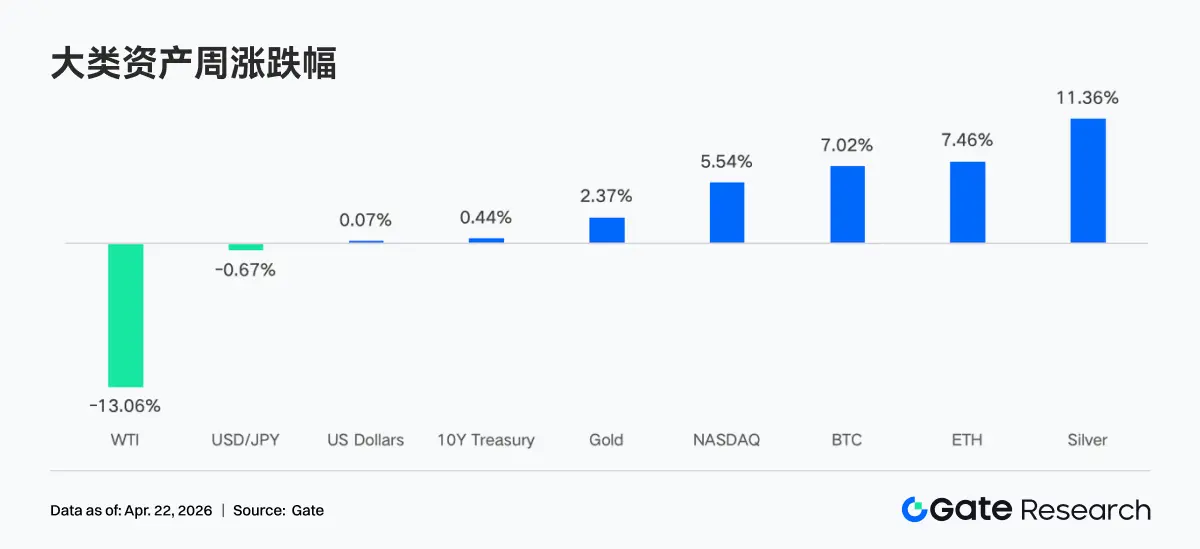
• In the past week, the market has fluctuated upward amid easing geopolitical conflicts and stable liquidity expectations, with a significant drop in oil prices, a decline in VIX, and a weakening dollar, all contributing to a recovery in risk appetite, leading to a rebound in crypto assets and a return to the upward range.
• The funding side has shown significant improvement, with both BTC and ETH ETFs recording strong net inflows, as institutional funds have refocused on leading products, with a preference for low-fee and high-liquidity assets.
• The trading structure exhibits characteristics of "energy dominance and on-chain active differentiation," with TradFi crude oil and other commodities maintaining a high proportion, while DEX trading volume has significantly rebounded.
• The internal structure of stablecoins and DeFi has seen a rebalancing, with funds withdrawing from yield-bearing and protocol-based stablecoins, while LST protocols have seen a return of funds.
• Security incidents have triggered chain reactions, leading to deleveraging and soaring interest rates in lending protocols like Aave.
• The derivatives market continues to show a pattern of "crowded shorts but rising prices," with deeply negative funding rates diverging from rising prices, accumulating short squeeze momentum.
1. Market Focus Interpretation
The global cryptocurrency market is exhibiting a fluctuating trend amid complex macroeconomic signals. On Friday, the trade war situation eased somewhat, but on Saturday, there were attempts to reverse this. Iranian Foreign Minister Amir-Abdollahian announced that the Strait of Hormuz is "completely open" to all merchant ships during the ceasefire between Israel and Lebanon. Trump quickly confirmed that the strait is "completely open and can be navigated at any time." Thanks to market optimism regarding a Middle East peace agreement, oil prices plummeted by 10%. The crypto market rebounded, and ETFs continued to achieve net inflows. U.S. stocks rebounded from their lows and reached historic highs, with the S&P 500 index rising 11% over 11 trading days since its low on March 30, setting a historic high of $7,162 last Friday. The VIX index plummeted to 17.48, the lowest level since late February, indicating that the market has substantially repriced war risks. The yield on 10-year U.S. Treasuries closed around 4.28%, down from a high of 4.44% in April. The dollar index fell below 98 for the first time since January.
According to the World Economic Outlook released by the International Monetary Fund (IMF) on April 16, 2026, the global economic growth forecast has been downgraded to 3.1% due to ongoing conflicts in the Middle East and the transmission of geopolitical risks, which has weakened the overall liquidity expectations for risk assets. The Fed's actions remain the core driving force for the market, with the market largely pricing in a 98% probability that the Fed will maintain interest rates at the April 29 meeting. Additionally, the confirmation hearing for Fed Chair nominee Waller is scheduled for April 21, and his hawkish or dovish policy tendencies will directly impact market liquidity in the coming weeks.
2. Liquidity Analysis
2.1 BTC ETF Records Largest Positive Week in Months
Last week, BTC ETF saw significant intraday volatility, with strong net inflows on April 14 and 15, reaching $411.4M and $186.1M, respectively. On April 17, amid a mix of risk aversion and bargain-hunting sentiment, it recorded an astonishing single-day net inflow of $663.9M. The weekly net inflow for BTC ETF was approximately $996.4M, while Ethereum ETF saw a weekly net inflow of $275.8M. In comparison, the flow situation for BTC ETF last week showed significant improvement over the previous week, marking the largest positive week since mid-January, with overall sentiment rapidly switching between risk aversion and bargain hunting, ultimately favoring the bulls.
Top BTC ETF net inflow products:
IBIT (BlackRock) weekly net inflow of $906.0M
ARKB (Ark & 21Shares) weekly net inflow of $98.5M
Top ETH ETF net inflow products:
FETH (Fidelity) weekly net inflow of $126.0M
ETHA (BlackRock) weekly net inflow of $99.2M
Institutional funds showed a clear trend of concentration last week. BlackRock's IBIT remained the main capital attractor, with a staggering weekly inflow of $906.0M, bringing its cumulative net inflow close to $64.63B. In contrast, Fidelity's FBTC experienced a net outflow of $104.0M, indicating a capital competition among different institutional products. In the Ethereum space, Fidelity's FETH performed well, leading with a net inflow of $126.0M, while Grayscale's ETHE continued to face a net outflow pressure of $16.67M. This differentiation indicates that institutional investors are placing greater emphasis on fee structures and liquidity depth when selecting products.
Currently, the total assets under management (AUM) of Bitcoin ETFs have strongly surpassed the $101.45B mark, with ETF net assets accounting for 6.55% of Bitcoin's total market capitalization. For Ethereum spot ETFs, the total net asset value has reached $14.26B, with ETF net assets accounting for 4.87% of Ethereum's total market capitalization.
2.2 TradFi Liquidity
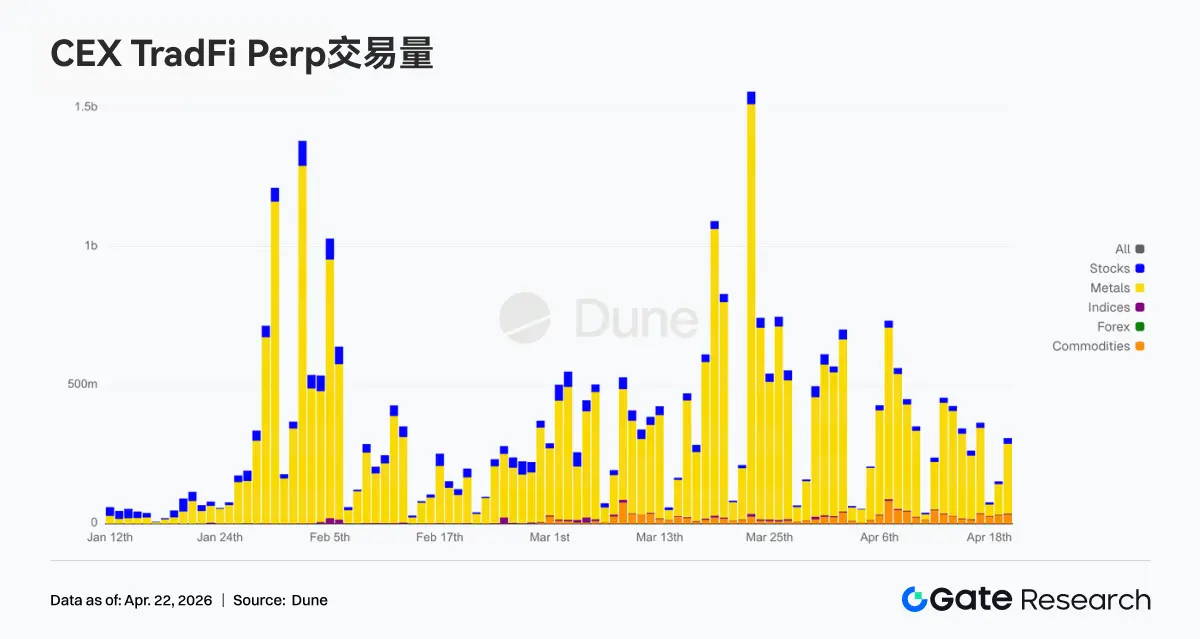
In the past week, the trading structure of TradFi Perp DEX has clearly tilted towards crude oil varieties, with CL and Brent maintaining a high proportion but slightly retreating from previous levels, still remaining the dominant force; meanwhile, WTI has slightly rebounded, and the energy sector remains strong overall. In precious metals, the proportions of gold and silver have recovered somewhat but remain below recent highs, indicating a marginal weakening of risk aversion demand. The proportions of stock indices and foreign exchange have remained relatively stable, with the market overall showing a pattern of "energy dominance, balanced by other assets."
In the past week, the daily trading volume of CEX TradFi perpetual contracts mostly ranged between $250 million and $450 million, significantly down from the approximately $750 million peak in early April, indicating a consolidation after high-level fluctuations. Structurally, metals remain the absolute mainstay, with stocks contributing secondarily, and the proportion of commodities has moderately increased since the end of March, while stock indices and foreign exchange volumes remain relatively small. At the end of the cycle, daily volume rebounded to about $450 million, indicating that after volatility convergence, funds are still concentrated in rotating sectors like metals, with TradFi activity gradually returning to a normal trading rhythm after extreme volume.
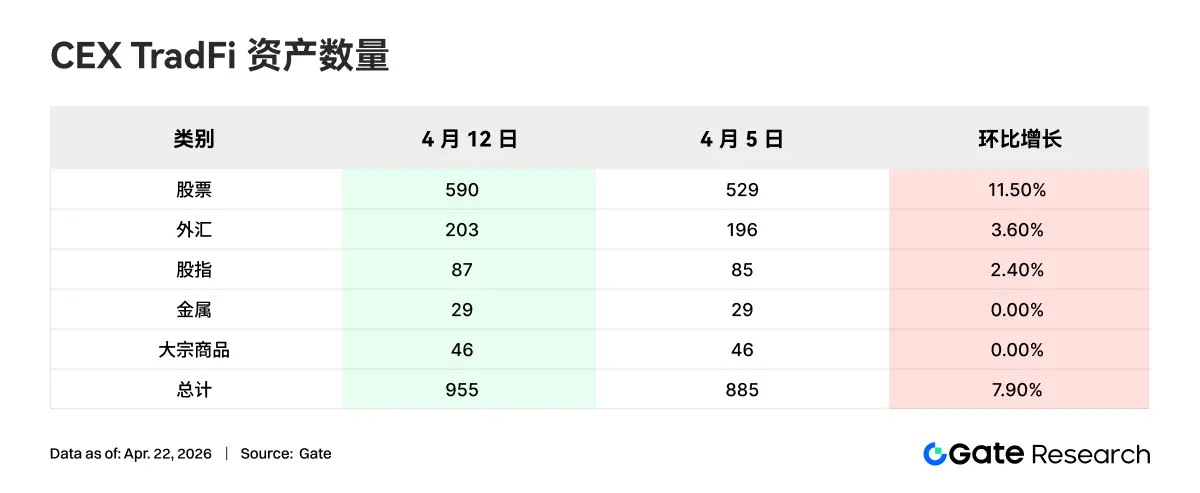
In the past week, the number of asset categories in CEX TradFi has further expanded, with the total number of TradFi asset categories (counting only TradFi and CFD segments, excluding perpetual contracts) increasing from 885 to 955, a 7.9% week-on-week growth. Among them, the growth in stocks was the most significant, increasing from 529 to 590, a week-on-week growth of 11.5%; Gate's stock TradFi increased by 16, a week-on-week growth of 6.5%.
We selected XAUT, the highest trading volume in TradFi, to analyze its order book depth (Delta). Over the past week, the order book for XAUT spot within a ±1% price range shifted from being dominated by selling pressure to an increase in buying interest: during the early to mid-April price dip and consolidation phase, liquidity Delta was significantly negative multiple times, with sell orders accumulating more noticeably near the current price; as the price rebounded from around $4,640 and consolidated at high levels between $4,780 and $4,820, Delta shifted to predominantly positive values, especially at the end of the cycle, where a positive spike close to about $900,000 appeared, indicating a relative increase in near-term buying depth.
3. On-Chain Data Insights
3.1 BNB Chain Meme Activity Surges, PancakeSwap Trading Volume Doubles
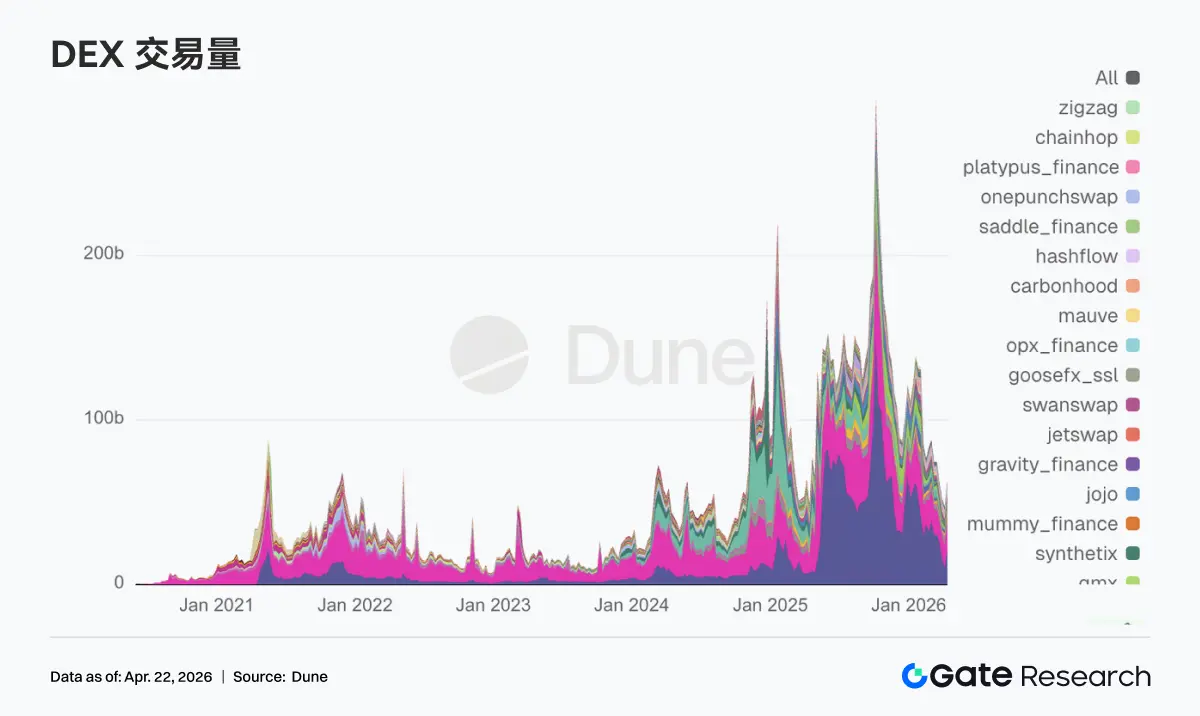
The trading heat and market capitalization of BNB Chain Meme, represented by "Binance Life," have significantly risen, with PancakeSwap's weekly trading volume reaching $21 billion, nearly doubling from the previous week, reclaiming the top position in DEX trading volume. Meanwhile, trading on mainstream DEX pools such as Uniswap, Aerodrome, Curve, and Fluid has also seen varying degrees of growth. There remains trading demand within Solana, with short-term speculation not retreating; rather, the active funds in Meme have shifted preference to the BNB Chain network, which has a deeper connection to exchanges.
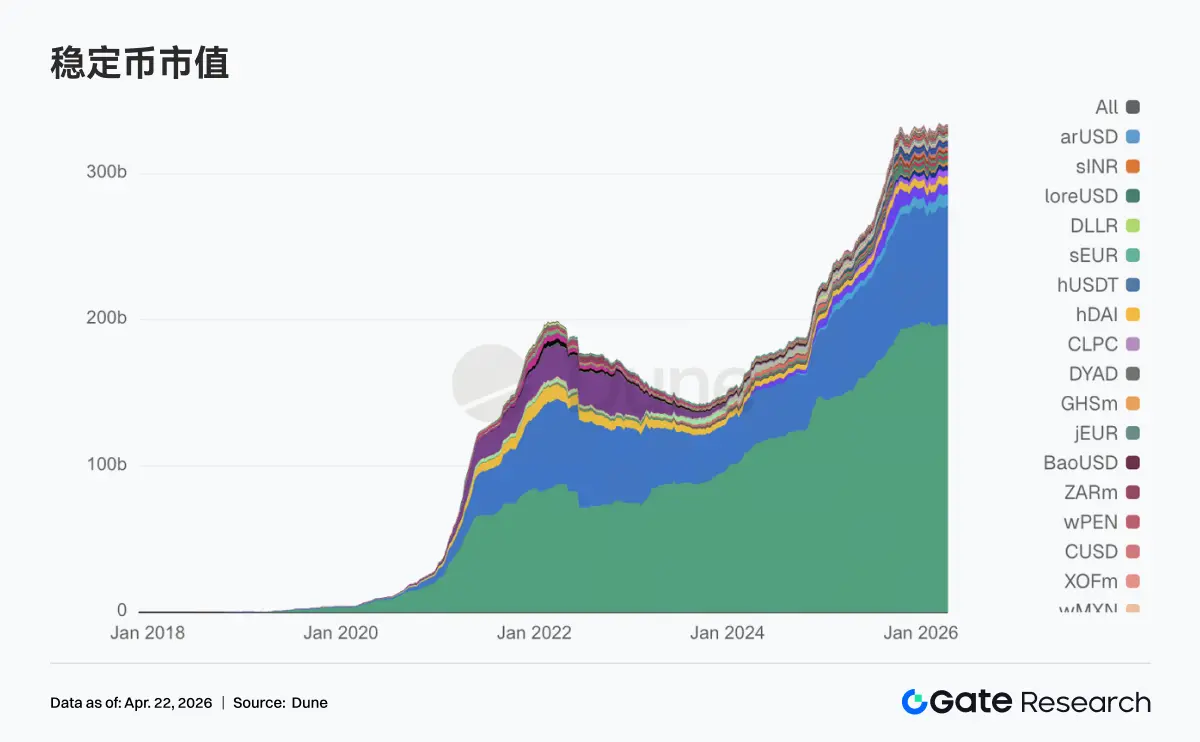
3.2 Stablecoin Sector Fluctuates at High Levels, Some Funds Withdraw from Yield-Bearing and Protocol-Based Stablecoins
The total amount of stablecoins has not seen drastic contraction, but internal reallocation is evident, with stablecoins that previously attracted funds due to yield seeing widespread reductions this week. USDT increased by about $1.02 billion compared to the previous week; USDC slightly retreated and did not expand alongside USDT. Possibly influenced by recent frequent security incidents, the withdrawal from the DeFi native side has been significant. USDS dropped from $8.56 billion to $7.80 billion, USDe fell from $6.70 billion to $6.41 billion, and DAI also saw a slight decline. However, payment-type and institutional-level stablecoins remained unaffected, with PYUSD and USDG both seeing slight increases.
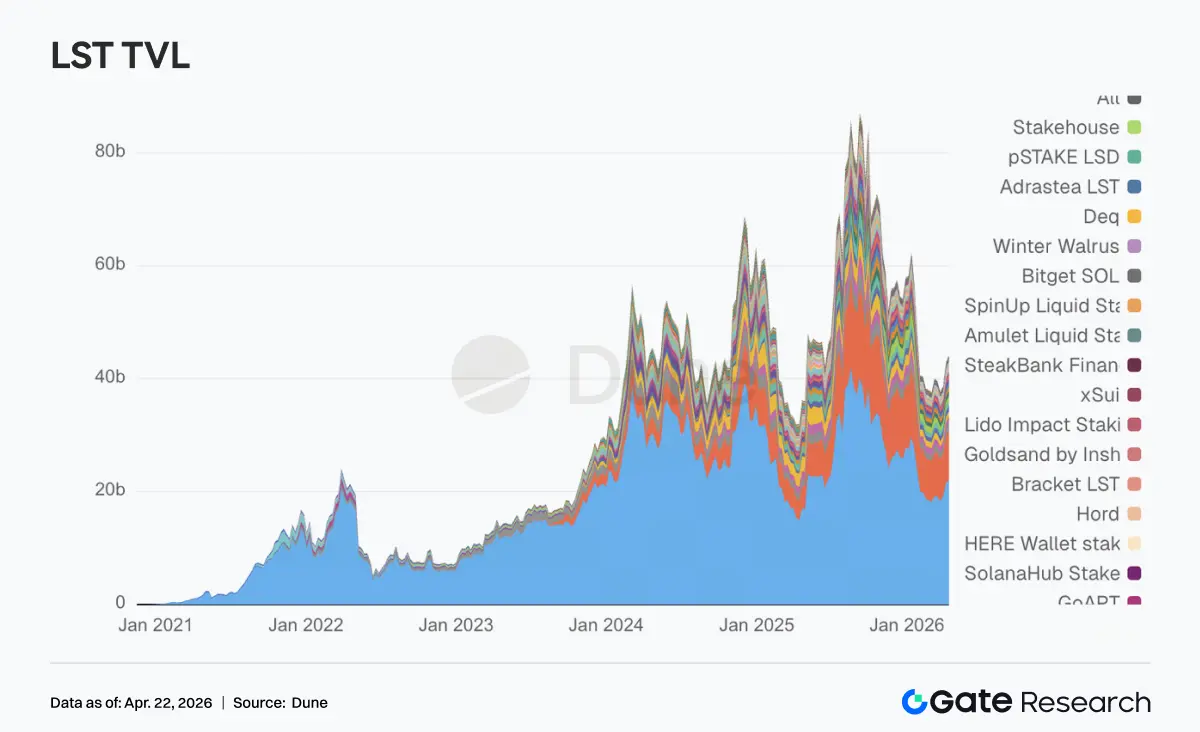
3.3 LST Not Dragged Down by rsETH Incident, Funds Instead Flow to Leading Protocols
Despite the nearly $300 million security incident involving the LRT protocol KelpDAO's rsETH over the weekend, the LST sector has proven to be more resilient than expected, with most leading protocols making gains. Lido, Rocket Pool, and other leading ETH-side LSTs have seen inflows in the hundreds of millions or tens of millions of dollars. On the SOL side, Sanctum Validator LSTs and Jupiter Staked SOL have also seen growth, with only Jito experiencing a slight decline. This reflects that DeFi players in the market have matured, showing no excessive panic, but rather separating the pricing of standardized staking assets from those with cross-chain, cross-chain packaging, and re-staking leverage. The issues with KelpDAO were related to risks associated with rsETH and cross-chain bridges, while traditional ETH LSTs and mainstream SOL LSTs have not been categorized as high-risk assets, instead benefiting from a return of funds.
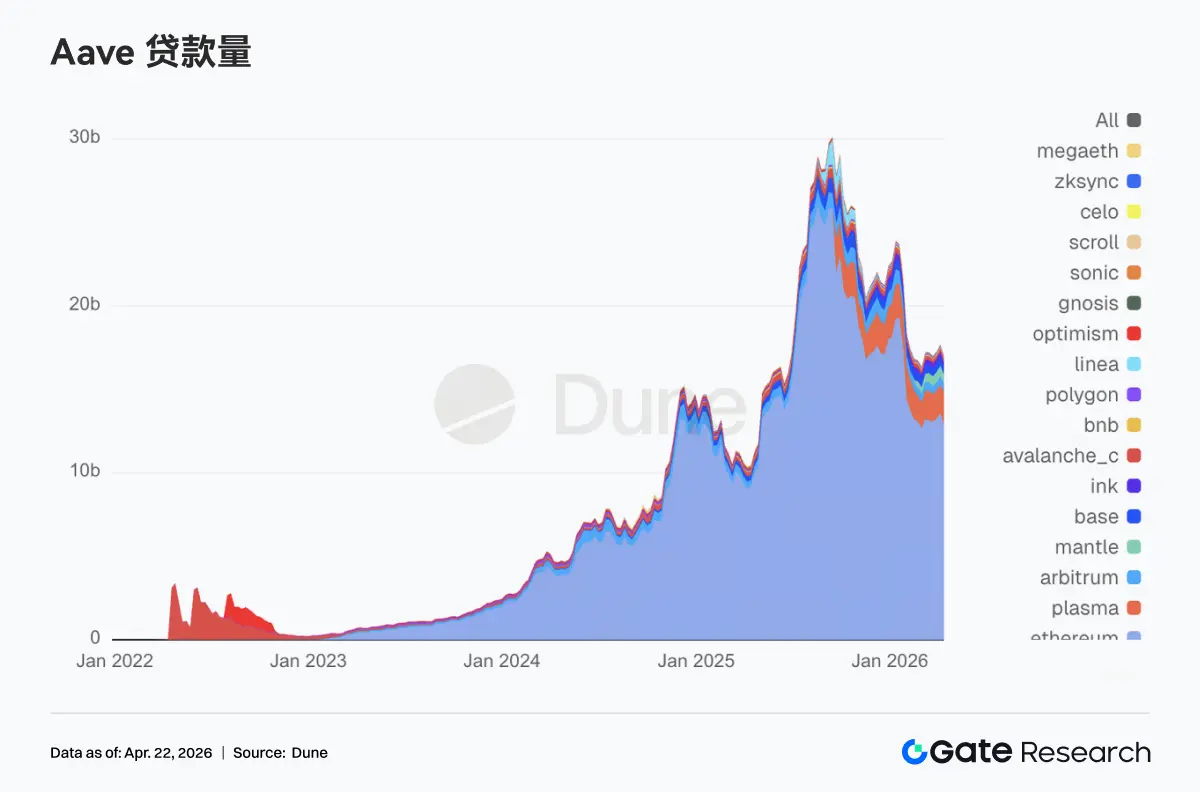
3.4 KelpDAO Incident Significantly Impacts Aave, Lending Funds Withdraw from Main Market
Aave's total loan balance has significantly declined, ending a steady upward trend. Loan scenarios in the Ethereum main market, Mantle, and Base core networks have seen several hundred million dollars in deleveraging. Aave froze rsETH collateral over the weekend and implemented protective restrictions on WETH across Core, Prime, Arbitrum, Base, Mantle, and Linea. Although Aave's contract itself was not breached, and the issue originated from KelpDAO's rsETH cross-chain bridge, Aave, as the largest lending pool, bore the most direct chain reaction, raising market concerns about potential bad debts arising from hackers using rsETH as collateral to withdraw hundreds of millions in funds. Consequently, the V4 Hub-and-Spoke risk isolation framework previously promoted by Aave Labs suddenly shifted from an architectural upgrade to a pressing market revaluation requirement.
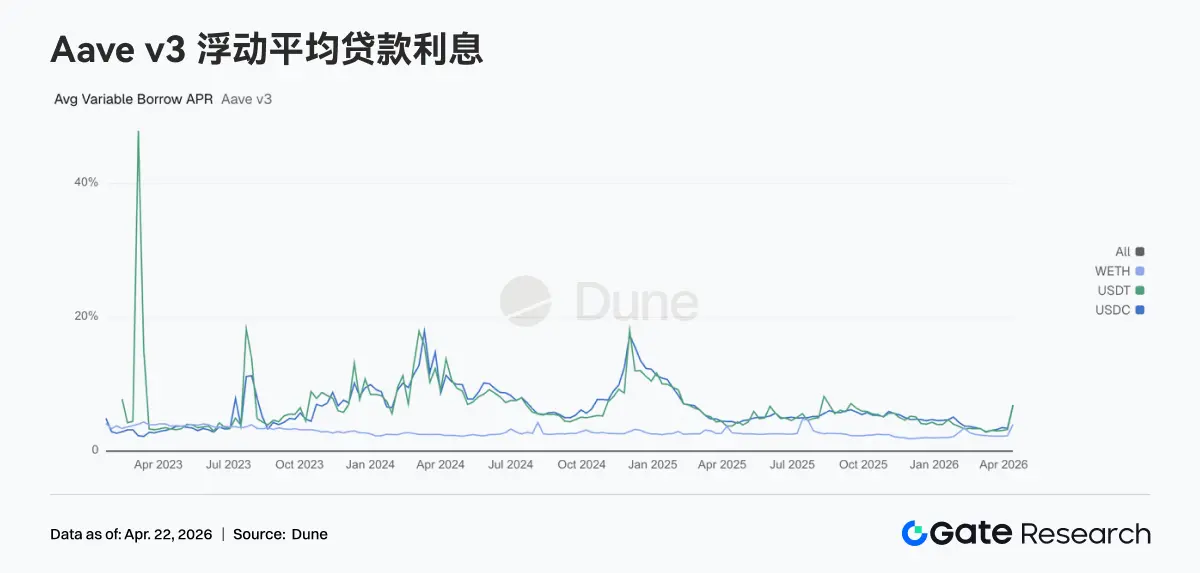
3.5 Security Incident Impact, Core Asset Loan Rates of Aave Surge Collectively
The interest rates reflect the instantaneous tension during the impact. The average floating borrowing APR for USDC jumped from 3.42% to 6.91%, USDT rose from 3.22% to 6.76%, and WETH increased from 2.29% to 4.00%. Following the rsETH incident, Aave faced bad debts and market panic spread, leading to liquidity and funds rapidly withdrawing from Aave, with the available depth of WETH and stablecoin pools in the main market thinning significantly, even reaching 100% utilization, leaving almost no liquidity. Aave's risk team subsequently made emergency adjustments to the WETH interest rate models for Arbitrum, Base, Mantle, and Linea, reducing the borrowing cost at full utilization from 8.5%-10.5% to 3%, which further confirmed the liquidity tightness in the pools at that time. This week's interest rate surge reflects a complete projection of an external black swan penetrating Aave's funding rates.
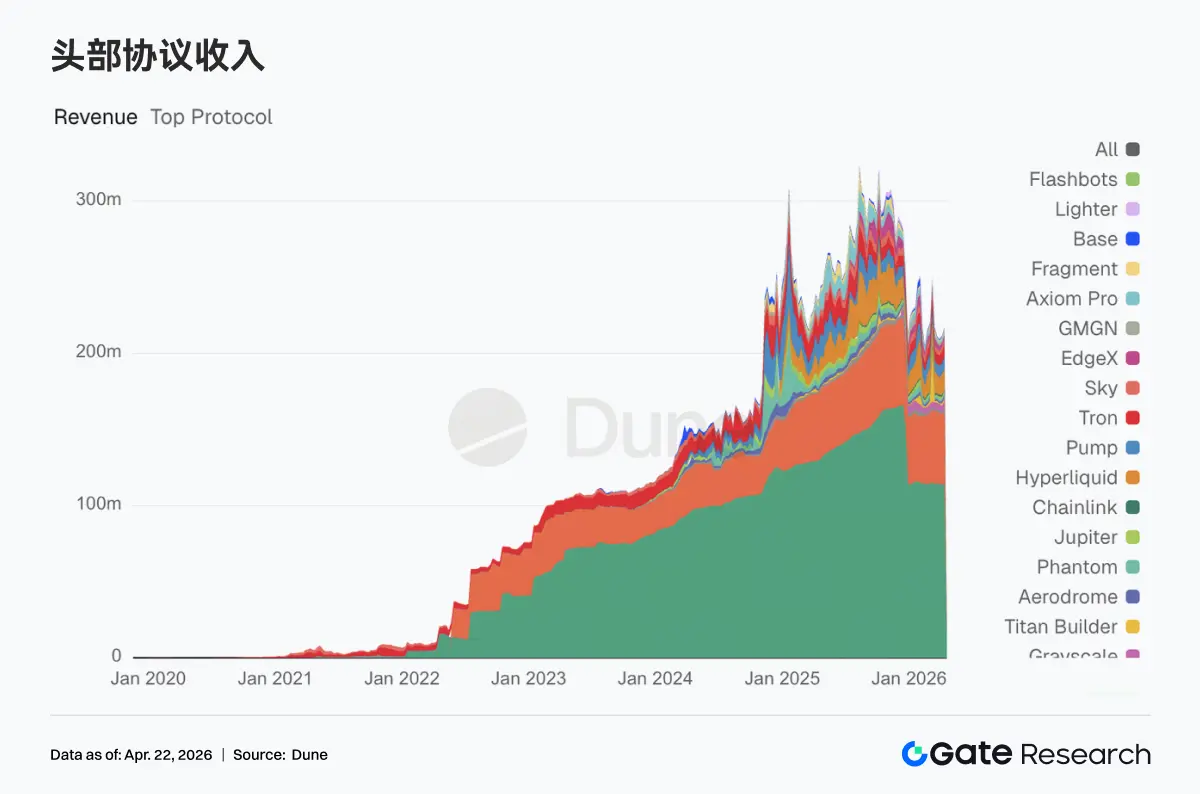
3.6 Leading Protocols Show Steady Revenue, Aave Exhibits Clear Stress Revenue Characteristics
Tether and Circle continue to hold the first and second positions, with stablecoin issuance being the most stable cash flow source. Hyperliquid and Pump's revenues have remained close to last week's highs, with on-chain trading still showing elasticity. Aave's revenue this week reached $2.02 million, showing a significant increase from the previous week, but this is stress revenue after liquidity was squeezed, with limited sustainability. Protocols like Aerodrome and Titan Builder, which reached weekly revenues of over a million dollars, have also seen growth, indicating that market funds have not left trading.
4. Derivatives Tracking
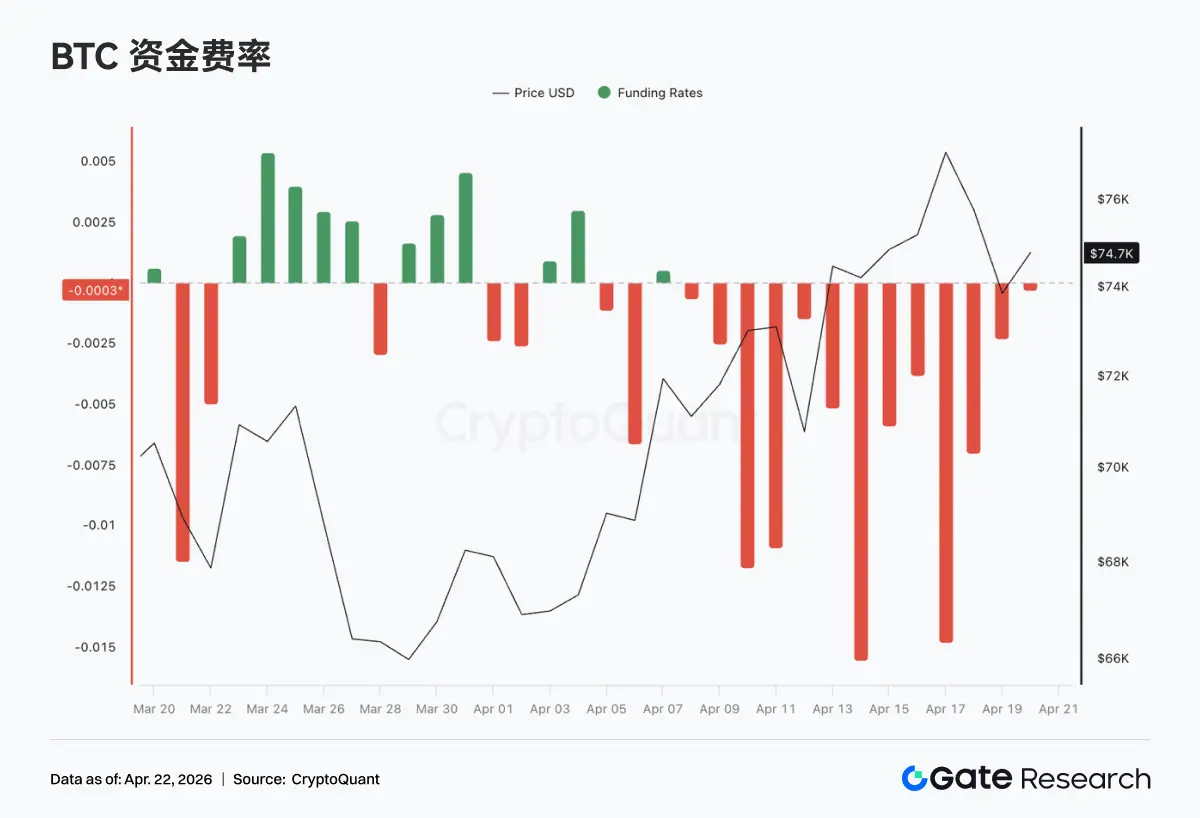
4.1 BTC Funding Rates Remain Deeply Negative, Prices Fluctuate Upward and Reach New Highs
In the past week, BTC funding rates have remained overall in negative territory, with multiple instances of extreme negative values (lowest close to -0.015) occurring around mid-April, indicating that bearish sentiment continues to dominate the perpetual contract market, with short positions remaining crowded. Correspondingly, after experiencing a prior correction, prices gradually fluctuated upward from around the $70K line, even peaking near $76K, presenting a typical divergence structure of "deeply negative funding rates but rising prices." This structure indicates that while shorts continue to pay funding fees, they are also under pressure from rising prices, with short squeeze momentum continuously accumulating, driven more by spot buying or passive short covering.
In terms of rhythm, after April 10, funding rates clearly shifted to deeper negative territory, while prices accelerated upward and reached new highs, indicating that during the price breakout process, shorts did not significantly stop-loss, and there may even be counter-trend accumulation behavior, further reinforcing the potential for a short squeeze. Overall, the current market is in a phase dominated by bearish sentiment but with strong price performance, with the derivatives side remaining bearish while spot or structural buying provides support. In this high-discrepancy structure, if prices maintain high levels or further rise, short covering may accelerate the market; however, at the same time, the sustained high negative funding rates also mean that once prices retract, leveraged shorts have a certain buffer, and short-term volatility may be significantly amplified.
4.2 BTC Options Structure Rapidly Repairs, Short-End Elasticity Increases and Flattens
Between April 13 and April 19, the implied volatility of BTC options overall showed a clear upward trend, with the structure gradually repairing from a previously relatively steep contango state. Specifically, the IV of short- to medium-term options such as 7D, 30D, and 60D remained at phase lows (around -6 to -8 range) near April 13 but then quickly rose, collectively moving up to around -3 to -4 around April 17, significantly enhancing volatility elasticity. In contrast, the upward movement of long-end IVs like 90D and 180D was relatively limited, with the overall curve showing a clear "flattening" characteristic, indicating that the market's pricing of short-term volatility has significantly increased.
Structurally, around April 17, the short-end was noticeably higher than the medium and long-end, with the options structure briefly showing signs of inversion, reflecting the market's rapidly warming expectations for short-term event-driven or price volatility. This sharp rise in short-end IV typically corresponds to phases of accelerated market activity or concentrated releases of uncertainty, with trading reflecting more of a chase for gamma and increased short-term hedging demand.
However, after April 18, as short-end IV quickly retreated (7D saw a significant pullback), it returned to a slightly positive slope, indicating that short-term sentiment has cooled, and the previously concentrated pricing of volatility expectations has begun to be partially realized or digested. Overall, the current IV options structure has undergone a process of "deep contango → rapid repair → short-end overheating → rebalancing," with the short-term market rapidly switching from extremely compressed volatility expectations to a revaluation of volatility. Structurally, this reflects that trading funds are quickly switching risk preferences within a short cycle, and attention should still be paid to whether price volatility converges synchronously during the IV retreat, or triggers a new round of volatility amplification.
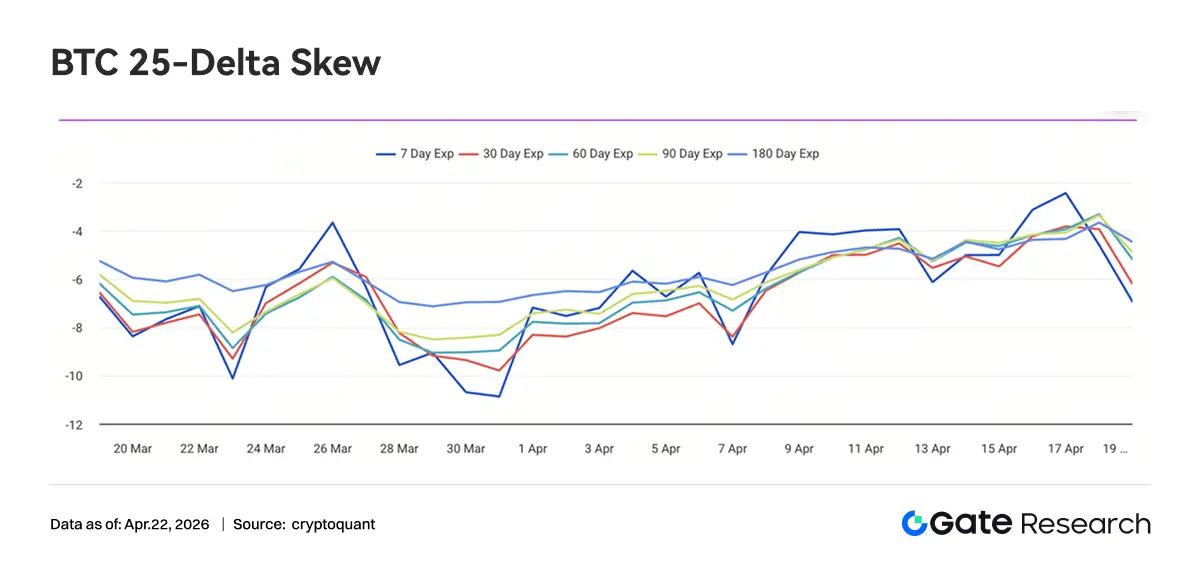
4.3 BTC 25-Delta Skew Significantly Rises, Tail Risk Pricing Continues to Converge
Between April 13 and April 19, the BTC 25-Delta Skew across all maturities remained in negative territory, but the central point has clearly shifted upward, primarily distributed in the -6 to -3 vol range. Compared to the extreme level below -10 at the end of March, the current Skew has significantly repaired by about 3-5 vol points, indicating that while Put premiums still dominate, the market's pricing of downside tail risks is continuously converging.
From a maturity structure perspective, the short-end (7D) Skew has been the most volatile, rapidly rising to near -2 around April 17, significantly higher than medium and long-end levels, reflecting a rapid cooling of short-term protective Put demand, even showing signs of "de-hedging" at times. Meanwhile, the Skew for medium to long-end options (30D to 180D) has remained relatively stable, generally maintaining in the -5 to -3 range, with some synchronous rises, but overall still not leaving the negative territory, indicating that the market retains a certain defensive allocation in the medium to long term.
Structurally, this round of Skew's rise resonates with price strength and volatility compression: as prices continue to rise, the market's demand for downside protection marginally decreases, leading to a gradual compression of Put premiums, but a positive Skew structure dominated by Call premiums has not yet emerged. This indicates that current market sentiment is shifting from "strong defense" to "weak defense," but has not entered a full risk appetite release phase.
Overall, BTC Skew has returned from extreme risk-averse pricing to a relatively neutral defensive range, with tail risk premiums significantly decreasing. In the short term, if prices remain strong, Skew still has room for further repair towards the -2 to 0 range; however, with the long-end still maintaining negative values, institutional funds have not fully shifted to offense, and the market overall remains in a transitional phase of "reducing hedges but not fully unwinding."
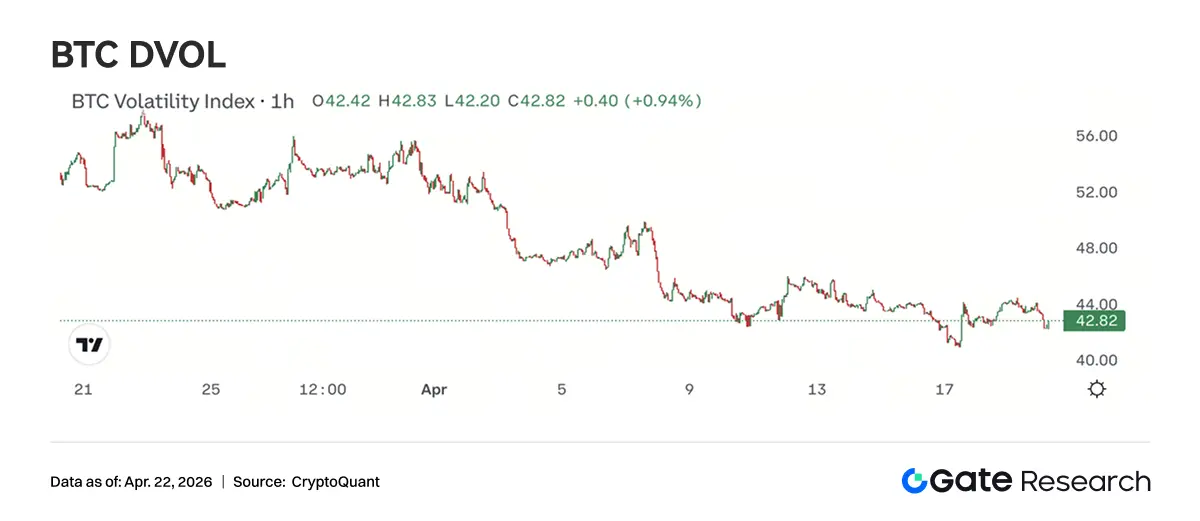
4.4 DVOL Continues to Decline to Low Range, Volatility Premium Further Converges
BTC DVOL maintained a downward trend between April 13 and April 19, gradually falling from above 45 to around 42, with a slight rebound around April 13 that did not form a trend upward, followed by a continued decline, touching a phase low around April 17 (approximately 41). Current DVOL is significantly lower than early April levels and approaching a phase low range, indicating that the market's risk premium for short-term volatility is continuously being compressed.
Structurally, this round of DVOL decline has not been accompanied by significant price volatility, but rather has gradually compressed during the price's upward fluctuations, reflecting the market's consistent expectation of "trend upward but low volatility." Compared to previous volatility pulses driven by events (such as short-term rapid increases), the current DVOL decline is smoother, indicating that the market's pricing of sudden risks has clearly dulled, and volatility premiums are being systematically reduced. Current DVOL is gradually approaching the edge of the low volatility range of 40-45, and if it further dips, it will enter historically low levels. In this context, selling volatility strategies (such as selling straddles or selling wide strangles) still dominate, but as DVOL continues to compress, their profit margins are narrowing, and marginal cost-effectiveness is declining.
5. Outlook for This Week
Data Sources:
• Investing, https://investing.com/currencies/xau-usd-historical-data
• Gate, https://www.gate.com/trade/BTC_USDT
• CMC, https://coinmarketcap.com/real-world-assets/?type=all-tokens
• Coinglass, https://www.coinglass.com/pro/depth-delta
• Dune, https://dune.com/gateresearch/gate-tradfi#weekly-volume
• Dune, https://dune.com/gateresearch/gate-institutional-weekly-report
• Bybit, https://www.bybit.com/future-activity/en/tradfi
• Bitget, https://www.bitgettradfi.com/tradfi/XAUUSD
• CryptoQuant, https://cryptoquant.com/asset/btc/chart/derivatives
• Amberdata, https://pro.amberdata.io/options/deribit/btc/current/
Gate Research Institute is a comprehensive blockchain and cryptocurrency research platform that provides readers with in-depth content, including technical analysis, hot insights, market reviews, industry research, trend forecasts, and macroeconomic policy analysis.
Disclaimer
Investing in the cryptocurrency market involves high risks. Users are advised to conduct independent research and fully understand the nature of the assets and products they are purchasing before making any investment decisions. Gate does not assume responsibility for any losses or damages resulting from such investment decisions.
 Risk warning